
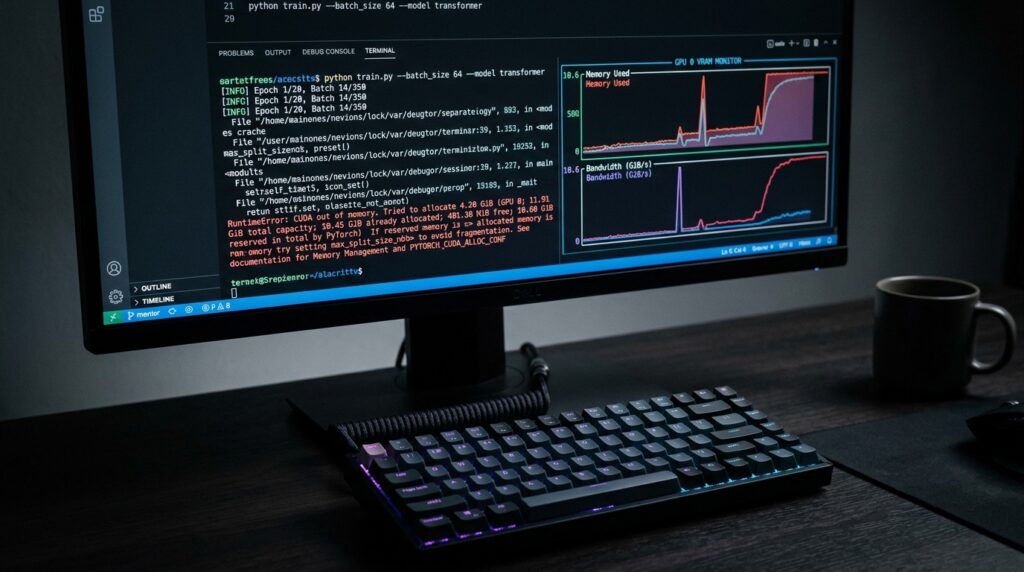
Few errors halt local AI development faster than seeing Ollama crash with a cryptic CUDA error: out of memory, a silent process termination by the Linux OOM killer, or an unexpected fallback to excruciatingly slow CPU inference. As developers push beyond basic chat prompts into autonomous multi-agent pipelines and extended 32k context windows, default Ollama configurations frequently fail to fit models into physical VRAM. Fortunately, resolving out-of-memory errors does not necessarily require upgrading to an enterprise GPU rig; by understanding how Ollama manages model runners, KV cache allocation, and partial layer offloading, you can permanently eliminate memory crashes.
In this engineering troubleshooting guide, we break down the five most effective architectural solutions to fix Ollama memory exhaustion on Nvidia GPUs, Apple Silicon Mac workstations, and hybrid CPU/GPU developer rigs. Whether you are running dense 14B–32B coding models or large Mixture-of-Experts architectures, these configuration adjustments will stabilize your local inference environment.
Why Ollama Crashes: The Hidden VRAM Culprits
When Ollama runs an inference job, your physical GPU memory is consumed by three distinct components: static model weights, CUDA/runtime driver overhead, and dynamic Key-Value (KV) cache context. In many cases, developers assume a model “should fit” based purely on its downloaded GGUF file size, only to experience an instant OOM crash upon submitting their first prompt. As explored in our Local LLM VRAM hardware guide, the dynamic memory requirements often exceed the weight footprint itself.
The three most common architectural causes of Ollama memory crashes include:
- Uncontrolled Context Expansion: By default, modern models support context lengths up to 32k, 64k, or even 128k tokens. Allocating a 32,768-token FP16 KV cache for a 32B model requires approximately 5.6 GB to 8.2 GB of additional uncompressed VRAM on top of the model weights!
- Multi-Runner Memory Hoarding: In recent versions, Ollama introduced automated parallel processing. If unconfigured, the background daemon may spin up 4 parallel runner slots (
OLLAMA_NUM_PARALLEL=4), multiplying your KV cache memory allocation by fourfold and immediately exhausting remaining VRAM. - Persistent Background Models: Ollama keeps recently queried models resident in GPU memory for 5 minutes (
OLLAMA_KEEP_ALIVE=5m). If your pipeline switches between an embedding model and an LLM, both models stay pinned in VRAM simultaneously.
Fix 1: Tune Parallel Slots with OLLAMA_NUM_PARALLEL
The single fastest way to reclaim up to 6GB of wasted VRAM on single-developer workstations is restricting the parallel inference slots. On Linux and macOS, Ollama automatically allocates parallel request slots based on available system resources, which frequently overcommits dedicated VRAM on 16GB and 24GB GPUs.
To restrict Ollama to a single dedicated runner stream, set OLLAMA_NUM_PARALLEL=1 in your environment:
# On Linux (systemd service)
sudo systemctl edit ollama.service

# Add the following lines inside the override block:
[Service]
Environment="OLLAMA_NUM_PARALLEL=1"
Environment="OLLAMA_MAX_LOADED_MODELS=1"

# Save and restart the service
sudo systemctl daemon-reload
sudo systemctl restart ollama
On macOS or when launching Ollama from the CLI manually:
export OLLAMA_NUM_PARALLEL=1
export OLLAMA_MAX_LOADED_MODELS=1
ollama serve
This simple change prevents duplicate KV cache buffers from being pre-allocated in your GPU memory, ensuring that 100% of your VRAM remains available for the active task.
Fix 2: Constrain Context Length via Custom Modelfile (num_ctx)
If you are attempting to run a 30B–32B model (such as the coding models analyzed in our Qwen3-Coder 30B MoE benchmark) on a 16GB or 24GB GPU, context size is the make-or-break variable. A model might load fine at 2,048 tokens, but crash immediately when an IDE agent sends an entire codebase file spanning 16k tokens.
Create a dedicated Modelfile to lock the maximum context length to a stable threshold:
# Create a custom Modelfile
FROM qwen2.5-coder:32b-instruct-q4_K_M

# Lock context window to 8,192 tokens instead of 32,768
PARAMETER num_ctx 8192

# Ensure temperature and top_p remain stable
PARAMETER temperature 0.2
Build the customized model instance with your pinned context limit:
ollama create my-coder:32b -f ./Modelfile
ollama run my-coder:32b
By capping the context window to 8k tokens, you save over 4.5 GB of VRAM compared to 32k context, allowing 32B models to fit entirely within hardware like the RTX 3090 without spilling into slow system memory.
Fix 3: Fine-Tune Layer Offloading with num_gpu
When a model is slightly too large for your GPU—for instance, trying to run a 24GB weight footprint on an RTX 4070 Ti Super with 16GB VRAM (detailed in our $1,000 GPU comparison)—Ollama defaults to calculating layer offloading automatically. If its heuristic is slightly too aggressive, it will attempt to push too many layers to the GPU, causing a CUDA out-of-memory crash during initial memory reservation.
You can manually instruct Ollama exactly how many layers to load onto the GPU versus system RAM using the num_gpu parameter in your Modelfile:
FROM mistral-small:24b

# Force exactly 26 out of 36 transformer layers to GPU
# The remaining 10 layers will safely execute in CPU RAM
PARAMETER num_gpu 26
PARAMETER num_ctx 4096
By explicitly setting num_gpu 2 to 4 layers below the automatic recommendation, you leave a stable 1.5GB safety margin in physical VRAM for CUDA kernel execution and prompt prefill spikes.
Fix 4: Enable KV Cache Quantization and FlashAttention
In standard llama.cpp and Ollama builds, Key-Value cache vectors are stored in FP16 precision. For long-context developer workflows, this is computationally wasteful. Enabling 8-bit or 4-bit KV cache quantization cuts your context memory overhead by 50% to 75% with virtually undetectable perplexity degradation.
You can verify and pass quantization flags to the underlying llama runner:
# Set environment variable for llama runner cache quantization
export OLLAMA_FLASH_ATTENTION=1

# Run with experimental quantized KV cache
OLLAMA_LLAMA_KV_CACHE_TYPE=q8_0 ollama serve
When FlashAttention is enabled alongside q8_0 KV cache, a 16,384-token context buffer that previously required 3.8 GB of VRAM shrinks down to just 1.9 GB, drastically reducing memory bus pressure and preventing OOM failures.
Fix 5: Adjust OS Memory Allocations (macOS & Linux)
If you are experiencing crashes where Ollama abruptly exits without a standard Python or CUDA traceback, your operating system’s kernel is likely terminating the process due to system memory limits.
| Operating System | Failure Symptom | Root Cause | Terminal Fix |
|---|---|---|---|
| macOS (Apple Silicon) | Process killed at ~75% RAM usage | macOS default Metal GPU working-set limit | sudo sysctl iogpu.wired_mem_limit=30000 |
| Ubuntu / Debian Linux | Killed message in dmesg |
Linux kernel OOM killer triggered | sudo sysctl -w vm.max_map_count=262144 |
| Windows (WSL2) | WSL2 instance abruptly restarts | WSL2 memory cap in .wslconfig |
Increase memory=28GB in C:\Users\<User>\.wslconfig |
On Apple Silicon hardware (such as the Mac mini M6 unified memory architecture), macOS artificially caps Metal allocations to approximately 72%–75% of physical memory by default. Expanding sysctl iogpu.wired_mem_limit allows Ollama to safely utilize up to 88% of physical unified memory without crashing.
Ollama Memory Troubleshooting Matrix
Use this reference table to immediately match your specific error message to the correct configuration fix:
| Error Output / Symptom | Primary Cause | Recommended Action |
|---|---|---|
CUDA error: out of memory |
VRAM completely filled during prompt prefill | Reduce num_ctx to 8192 or set OLLAMA_NUM_PARALLEL=1. |
| Model offloads to CPU automatically | Weights + KV cache exceed GPU headroom | Lower quantization tier (switch Q8 to Q4_K_M) or manually set num_gpu. |
| Ollama exits silently with code 137 | Linux OOM Killer killed process | Increase system swap space or reduce OLLAMA_MAX_LOADED_MODELS=1. |
| High latency on prompt evaluation | Memory paging over PCIe bus | Check that all layers fit resident in VRAM using ollama ps. |
If you require massive multi-user throughput or production API hosting where manual Modelfile tuning becomes cumbersome, consider reviewing our benchmark comparison of vLLM vs. Ollama vs. SGLang to evaluate how PagedAttention runtimes manage concurrent memory dynamically.
Frequently Asked Questions
How do I check how much VRAM Ollama is currently using?
Run ollama ps in your terminal. It will output the active running model, the percentage offloaded to GPU (e.g. 100% GPU or 72% GPU / 28% CPU), and the exact VRAM footprint allocated in real time.
Why does Ollama use more VRAM than pure llama.cpp?
Ollama bundles additional HTTP API server layers, automated model runner management, and pre-allocated buffer pools for concurrent requests. Running with OLLAMA_NUM_PARALLEL=1 narrows this gap to within 200MB of pure llama.cpp.
Can I instantly unload a model from VRAM without restarting Ollama?
Yes. Run ollama stop <model-name>, or make an empty API request with {"model": "qwen2.5-coder:32b", "keep_alive": 0}. This immediately releases 100% of the allocated GPU memory back to your operating system.