

There is a version of industrial automation that has been promised for decades: fully autonomous factories, zero-defect production lines, supply chains that self-correct in real time. Some of that vision is arriving. Most of it is still arriving in pieces, and the pieces that are actually here the ones delivering measurable returns in real operations today look nothing like the marketing presentations.
For entrepreneurs running asset-heavy operations, the question is not whether AI in industrial automation is real. It is which parts are real right now, which parts are ready for your scale, and how to sequence the investment so that each deployment builds on the last rather than starting from scratch.
This is that guide. No theoretical frameworks, no feature comparisons lifted from vendor websites. Just a clear map of what is working, where it is working, and what it takes to get there from where most operations actually start.
What AI in industrial automation means in practice
The term covers a wide range of technologies, and the range matters because different applications address fundamentally different operational problems. Grouping them all under one label creates the impression that deploying AI in industrial automation is a single decision. It is not. It is a series of decisions, each with its own data requirements, integration complexity, and payback timeline.
At the broadest level, AI in industrial automation refers to the use of machine learning, computer vision, and predictive modeling to improve the performance of physical operations — manufacturing, logistics, energy management, quality control, and supply chain management. The intelligence layer sits above the physical infrastructure and uses operational data to make better decisions, faster, than the manual or rule-based systems it replaces.
What separates the deployments that deliver from the ones that disappoint is not the sophistication of the technology. It is the clarity of the operational problem being solved and the readiness of the data environment that the technology runs on. Those two factors problem clarity and data readiness determine the outcome of AI in industrial automation deployments more reliably than any platform feature comparison.
The practical landscape breaks down into five core application areas, each with a distinct value proposition, a distinct data requirement, and a distinct deployment profile. Understanding all five — and knowing which one fits your current situation is the foundation of a sound automation strategy.
industrial AI applications and where to start
The first question most entrepreneurs ask when they begin evaluating AI in industrial automation is the wrong one. They ask: which technology should I deploy? The right question is: which operational problem is costing me the most, and which AI application is proven to solve it?
That reframe matters because the technology landscape offers a genuinely broad set of capable options. Without a problem-first lens, the evaluation process becomes a feature comparison exercise that produces a purchasing decision rather than an operational improvement.
The industrial AI applications with the most documented ROI across small and mid-sized manufacturing and logistics operations cluster into a manageable set. Predictive maintenance eliminates the unplanned downtime that bleeds margin from asset-heavy operations. Machine vision removes the reliability ceiling of human quality inspection. Demand forecasting replaces static planning models with dynamic ones that respond to real market signals. Energy optimization targets one of the largest controllable cost lines in any production environment. And process automation connects the intelligence layer to the physical operation, translating data insights into real-time adjustments.
Each of these applications has a defined starting point, a documented implementation path, and a measurable payback profile. None of them requires a data science team or a purpose-built technology infrastructure to deploy at a first meaningful scale.
The sequencing decision — which application to start with — is determined by your specific cost and loss map. Where is your operation losing money in ways that are measurable, recurring, and large enough to justify an investment? That analysis, done honestly with actual numbers rather than general impressions, produces a priority order that vendor conversations cannot.
For a complete breakdown of each industrial AI application, the specific problems each one solves, and the evaluation framework for choosing your starting point, industrial AI applications: the uses you can’t ignorecovers the full landscape in the detail this section can only introduce.
AI-powered predictive maintenance — cut downtime before it costs you
Unplanned equipment failure is one of the most consistently underestimated costs in industrial operations. Most entrepreneurs who have not measured it directly assume it is a manageable inconvenience. The ones who have measured it total downtime hours multiplied by fully loaded production cost per hour, plus emergency repair premiums, plus downstream fulfillment impact — almost always find a number that reframes their entire maintenance strategy.
Predictive maintenance is the AI in industrial automation application with the fastest documented payback period across the widest range of operation types. The reason is structural: it converts the most expensive category of maintenance event — the unplanned breakdown — into a planned intervention that costs a fraction of the emergency alternative.
The mechanics are straightforward. Sensors attached to operating equipment — measuring vibration, temperature, pressure, electrical current, and acoustic output — generate a continuous stream of operational data. A trained model monitors that data stream for deviations from established baseline patterns. When the deviation crosses a threshold that historical data associates with an impending failure, the system generates an alert with enough lead time to schedule a repair during a planned maintenance window rather than scrambling during production hours.
The financial impact shows up in three places simultaneously. Direct repair costs drop because planned interventions are cheaper than emergency ones — parts are ordered at standard cost rather than expedited premium, and the repair scope is typically smaller when the failure is caught early. Downtime costs drop because planned maintenance windows are shorter and scheduled at low-impact times rather than occurring randomly across production shifts. And secondary damage costs drop because catching a bearing failure before it becomes a shaft failure, or a cooling system anomaly before it becomes a motor burnout, consistently reduces the total repair scope.
The equipment categories where predictive maintenance delivers the clearest and fastest returns are rotating machinery — motors, pumps, compressors, fans, gearboxes — because their failure modes produce detectable early signals that sensor systems capture reliably. HVAC and cooling infrastructure, CNC machines, and industrial robots round out the highest-priority asset categories for most manufacturing operations.
The deployment path is more accessible than most entrepreneurs expect. Modern sensor hardware is non-invasive — clip-on vibration sensors and wireless temperature probes attach to existing equipment without modification. Edge computing gateways process the sensor data locally before transmitting relevant signals to cloud analytics platforms, keeping latency low and bandwidth requirements manageable. And the leading platforms — Uptake, SparkCognition, Augury, Aspentech — offer pre-built models for common failure modes that significantly shorten the time from deployment to first actionable insight.

The 90-day deployment model that works consistently across operation types follows a clear sequence. The first 30 days establish data flows and baseline patterns for monitored assets — the system learns what normal looks like for each machine under real operating conditions. Days 31 through 60 run the system in parallel with existing maintenance practices, validating alerts against operator knowledge and calibrating detection thresholds to reduce noise without missing genuine signals. From day 61 onward, maintenance scheduling for monitored assets begins incorporating system recommendations, and the financial metrics — mean time between failures, planned versus unplanned maintenance ratio, cost per maintenance event — are tracked against pre-deployment baselines.
The operations that extract the most value from predictive maintenance do not stop at the first asset class. Once the data infrastructure is in place and the organizational confidence in the system is established, expanding coverage to additional equipment categories becomes significantly faster and cheaper than the initial deployment. The first deployment builds the capability. Subsequent ones leverage it.
The complete implementation guide for predictive maintenance — including platform comparisons, sensor selection, and the specific metrics that confirm the system is working — is in predictive maintenance AI: stop paying for breakdowns.
machine vision in manufacturing — how AI eyes outperform human inspection
Quality control is one of those operational functions that most entrepreneurs treat as a fixed cost until something forces them to look at it differently. A customer complaint that escalates. A return rate that keeps climbing. A product recall that makes the full cost of defect escape visible in a single painful number. At that point, the question is no longer whether to invest in better inspection — it is why the investment was not made sooner.
Machine vision in manufacturing is the answer to that question in 2026. And the case for it is not built on technology enthusiasm. It is built on the documented failure modes of the system it replaces.
Human visual inspection operates under constraints that do not improve with training or management attention. Fatigue degrades accuracy progressively across a shift. Lighting variation changes what is visible at the inspection point. Subtle defects — hairline cracks, minor color deviation, microscopic surface contamination — push against the limits of human perception even under ideal conditions. And at high production speeds, the time available per item for a human inspector narrows to the point where reliable detection of anything but the most obvious defects becomes physically impossible.
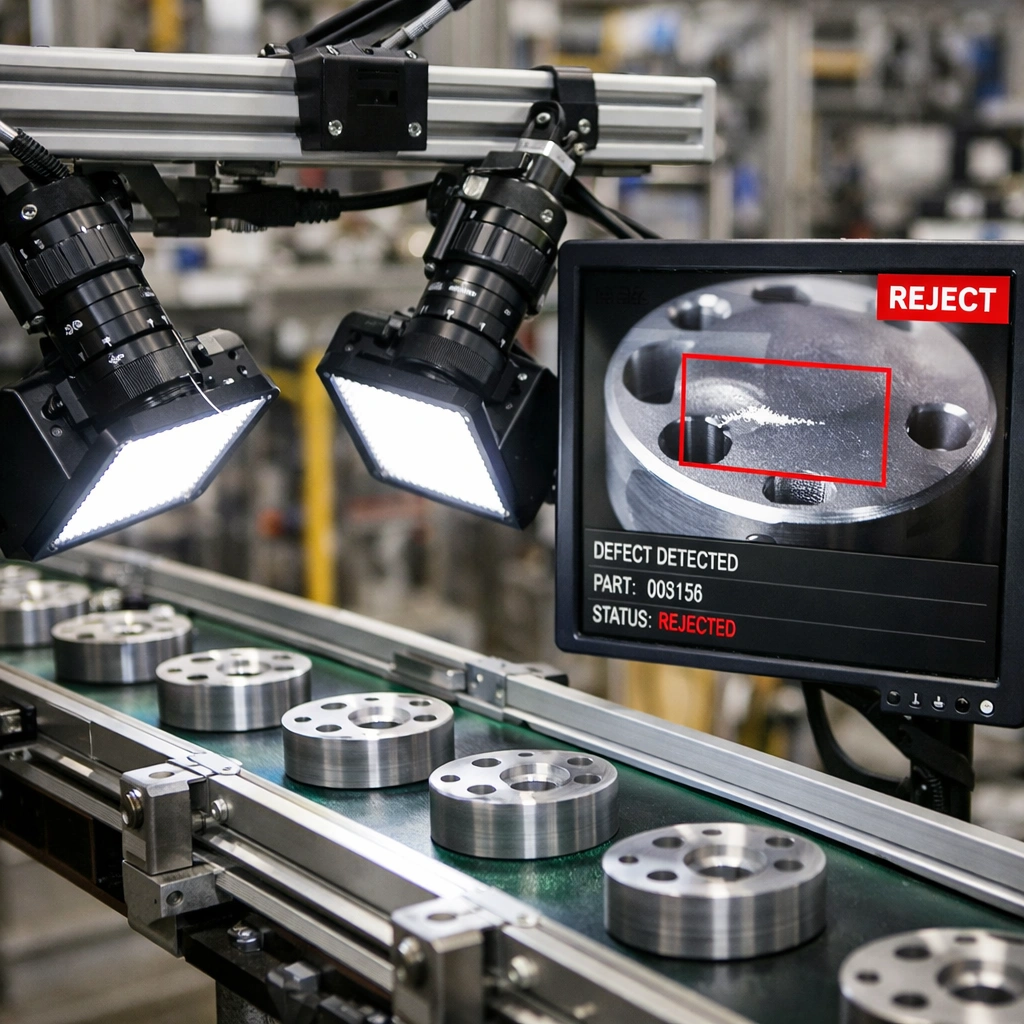
Machine vision manufacturing systems eliminate all of those constraints simultaneously. High-speed industrial cameras capture every item passing through the inspection point at full production speed. Controlled lighting, engineered specifically for the defect types being detected, makes surface characteristics visible that ambient lighting obscures. And trained detection models evaluate each captured image against a defect library built from real production samples improving in accuracy over time as they process more of your actual output.
The defect categories that machine vision handles with the highest accuracy are surface finish anomalies, dimensional deviations, assembly completeness errors, and contamination detection. These happen to be the categories where human inspection is most variable — the defects that one inspector catches reliably and another misses consistently, creating the inter-inspector variability that makes quality performance impossible to stabilize under manual inspection regimes.
The industries where machine vision manufacturing has the deepest deployment track record are electronics and semiconductor manufacturing, automotive parts production, food and beverage processing, pharmaceutical manufacturing, and packaging. The common thread is high volume combined with strict quality requirements — the exact conditions where manual inspection’s limitations compound fastest.
The platform landscape for machine vision in manufacturing has two distinct tiers that serve different deployment needs. Rule-based systems — where detection criteria are manually programmed for each defect type — are mature, reliable, and cost-effective for operations with well-defined, consistent defect categories. Deep learning systems — where models are trained on labeled image datasets rather than manually programmed — handle the variable, complex defect types that rule-based systems struggle with, and improve in accuracy as they process more production data over time.
Cognex remains the most widely deployed name in the rule-based tier, with strong hardware quality, extensive third-party integration support, and a large installer network that makes initial deployment less dependent on in-house technical expertise. For deep learning applications, Landing AI’s visual inspection platform and the ViDi suite within the Cognex ecosystem represent the most mature options for manufacturers dealing with defect complexity that exceeds what traditional vision tools can handle reliably.
The cost range for a first machine vision deployment — a single inspection station covering one product line — runs from approximately $15,000 to $60,000 for hardware and initial configuration, depending on inspection complexity, line speed, and integration requirements. That number needs to be evaluated against the fully loaded cost of the inspection process being replaced and the annual cost of defects currently escaping to customers. In most operations where manual inspection is the primary quality gate, that ROI calculation closes quickly.
The preparation steps that determine whether a deployment succeeds from day one are well-defined. Building a complete defect library — physical samples or high-quality images of every defect type the system needs to detect — before configuration begins is the single most impactful preparation step. The quality of the training data directly determines the speed at which the detection models reach reliable accuracy. Operations that arrive at system configuration with a well-documented defect library consistently reach production-ready performance faster than those that build the library reactively during the calibration period.
Lighting assessment is the second critical preparation step and the one most frequently underestimated. Machine vision systems are sensitive to lighting consistency in ways that are not intuitive until you have worked through an installation. Ambient light variation — from skylights, from shift-based overhead lighting changes, from reflective surfaces near the inspection point — can create false positives and missed detections that have nothing to do with the detection model’s quality. Addressing lighting before installation rather than troubleshooting it after goes live saves significant calibration time.
The complete platform comparison, deployment cost breakdown, and step-by-step preparation guide for machine vision manufacturing is inmachine vision manufacturing: why manual inspection is failing you — the resource to consult before beginning any vendor conversation in this space.
AI-driven supply chain optimization — from reactive to fully predictive
Supply chain problems have a way of presenting themselves as logistics failures when they are almost always information failures. A stockout that triggers an emergency purchase order at premium cost. An overstock position that ties up working capital for three months. A supplier delay that blindsides your production schedule because nothing in your current system was monitoring the signals that preceded it. Each of these events looks like an execution problem on the surface. Trace it back and you find a forecasting assumption that did not hold, a reorder point that was set eighteen months ago and never updated, or a supplier risk that was visible in the data but not in any report anyone was reading.
AI-driven supply chain optimization addresses the information layer. It does not make your trucks faster or your warehouses larger. It makes the decisions that determine how your supply chain operates — what to order, when to order it, how much to hold, where to position it, which suppliers to prioritize — more accurate, more timely, and more responsive to conditions as they actually are rather than as your last planning cycle assumed them to be.
The financial impact of that improvement is direct and measurable. Forecast accuracy improvements of 20 to 40 percent against pre-deployment baselines are consistently documented across mid-market deployments. That accuracy gain translates into lower safety stock requirements, fewer emergency replenishment orders, reduced inventory write-offs on slow movers, and a service level improvement that shows up in customer retention metrics rather than just internal KPIs.
The three functional areas where AI supply chain optimization delivers the most immediate financial impact are demand forecasting, inventory positioning, and supplier risk management. Each addresses a distinct information gap, and together they convert a supply chain that reacts to events into one that anticipates them.
Demand forecasting is the upstream variable. Every other supply chain decision runs on the forecast — inventory levels, production schedules, supplier purchase orders, logistics capacity commitments. A forecast that is systematically biased or that fails under conditions of demand variability creates errors that compound downstream through every decision it informs. AI forecasting models handle variability better than traditional statistical methods because they run multiple model types simultaneously and weight their outputs dynamically based on which is performing best for each product category under current market conditions. The result is a forecast that adapts rather than degrades when conditions shift.
Inventory optimization builds on forecast accuracy by continuously recalculating reorder points, safety stock levels, and order quantities for every SKU based on current demand patterns, current supplier lead time data, and current service level targets. The static reorder parameters that most operations set once and revisit infrequently are replaced by dynamic recommendations that update as the underlying variables change. For multi-location operations, the optimization layer also addresses cross-site inventory positioning — ensuring that stock is held where it is most likely to be needed rather than where it was convenient to put it during the last warehouse reorganization.
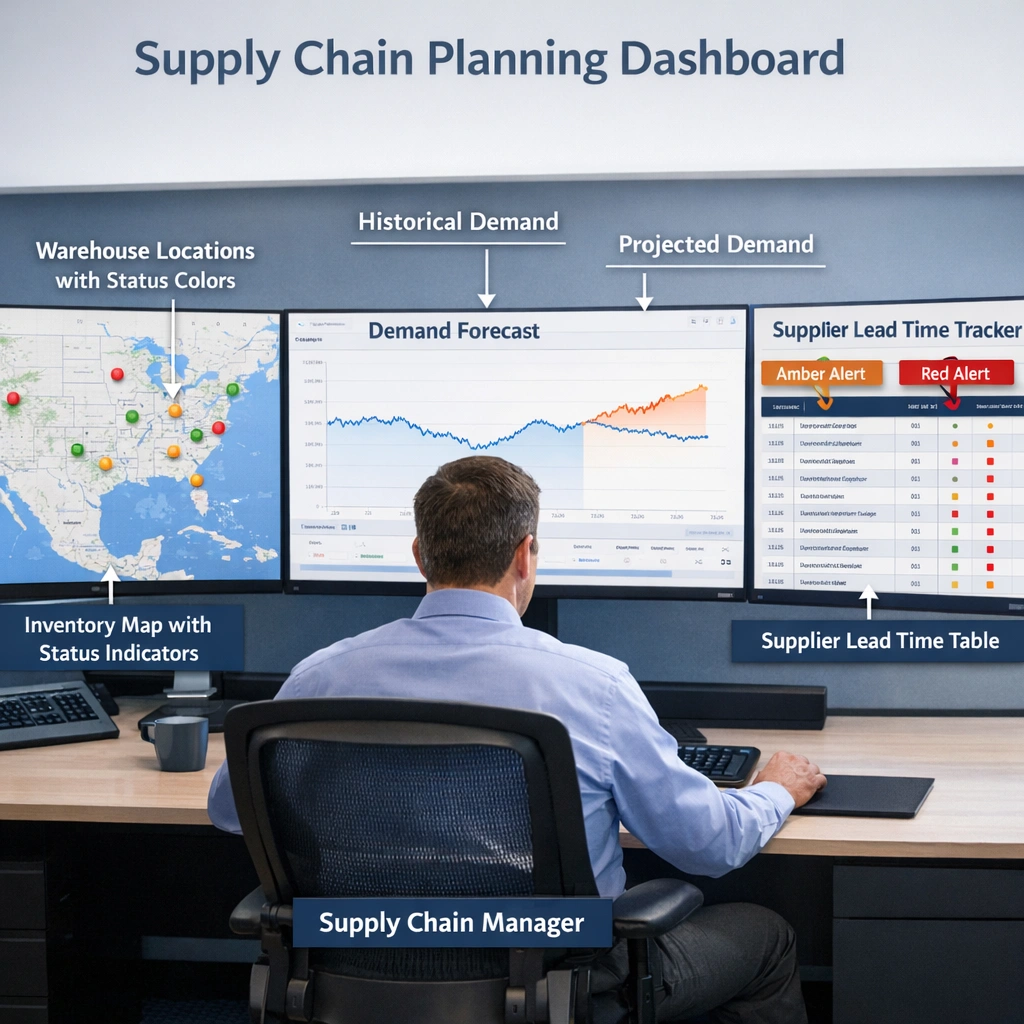
Supplier risk management is the third layer and the one that most operations are furthest from addressing systematically. Traditional supplier management relies on relationship knowledge and reactive escalation — you find out a supplier is in trouble when they miss a delivery, not before. AI-driven supplier monitoring changes that by continuously tracking financial health signals, shipping and customs delay patterns, geographic risk indicators, and news and regulatory data for supplier locations. When a supplier’s risk profile deteriorates, the system surfaces that information in time to take protective action — accelerating orders, qualifying alternatives, adjusting customer commitments rather than explaining a failure after it has already affected your customers.
The platform landscape for AI supply chain optimization is tiered by operational complexity. Blue Yonder and o9 Solutions serve mid-to-large operations with high SKU counts and multi-channel complexity. Kinaxis RapidResponse addresses the scenario planning needs of complex manufacturing supply chains where conditions change faster than traditional planning cycles can accommodate. Relex Solutions has built a particularly strong position in retail and consumer goods environments where promotional complexity and seasonal compression create the kind of demand variability that simpler platforms handle poorly.
The deployment sequence that produces the fastest time to value starts narrow. One product category with at least 24 months of clean sales history, managed through one planning team, with a clearly defined measurement baseline established before the system goes live. The data preparation requirement — cleaning and structuring the historical data that the forecasting models train on — is consistently the most underestimated part of the process, and the operations that get it right before deployment rather than during it consistently reach production-ready accuracy faster.
A realistic timeline from data preparation through the first production planning cycle running on system recommendations is 60 to 120 days, depending on data readiness and integration complexity with existing ERP and warehouse management systems. The 90-day measurement review — comparing forecast accuracy, inventory turnover, stockout frequency, and emergency purchase rate against pre-deployment baselines — is the honest checkpoint that tells you whether the system is calibrated correctly or whether the first deployment phase needs adjustment before scope expands.
The complete platform comparison, deployment expectations, and measurement framework for AI supply chain optimization is inAI supply chain optimization: end the guesswork for good— the resource that covers this application in the depth that a section of a pillar article cannot.
industrial AI platforms compared — which one fits your operation
The industrial automation software market presents entrepreneurs with a genuine problem that vendor evaluation guides rarely acknowledge honestly: the platforms that are most aggressively marketed are not always the ones best suited to the operations doing the evaluating. Enterprise platforms with large sales teams and substantial marketing budgets dominate awareness. Mid-market platforms that would serve most entrepreneurial operations better are harder to find and harder to evaluate because the information asymmetry between vendor and buyer is significant.
Closing that asymmetry requires a framework that starts with operational requirements rather than platform features. The right industrial automation software for your operation is not the one with the most capabilities. It is the one whose specific strengths align with your specific operational problem, whose deployment model matches your technical infrastructure, and whose total cost of ownership is realistic against your investment capacity over a three-year horizon.
The market organizes naturally into three tiers, and understanding which tier your operation belongs in before you begin vendor conversations saves significant time and prevents the expensive mistake of deploying enterprise infrastructure in an environment that cannot support it.
The enterprise tier — Siemens Opcenter, Rockwell Automation FactoryTalk, GE Digital Proficy — is built for operational complexity at scale. Multi-site manufacturing networks, highly regulated industries with full traceability requirements, and facilities with thousands of connected assets generating continuous high-volume data streams are the environments these platforms are designed for. Their depth is genuine. So is their implementation complexity. Deployment timelines of six to eighteen months, implementation service costs that frequently exceed annual license fees, and the internal technical resource requirement to operate them effectively make them the wrong choice for operations that do not have the complexity to justify that investment.
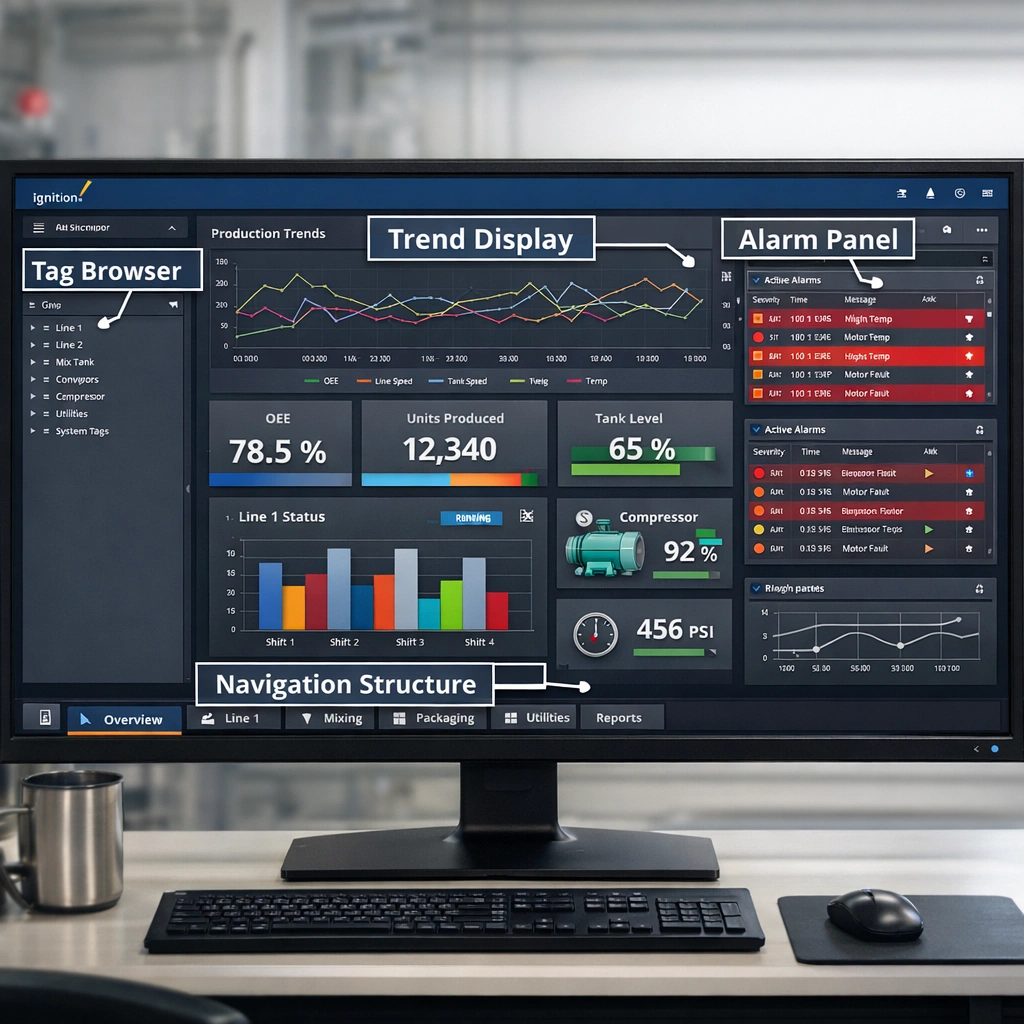
The mid-market tier is where most entrepreneurial manufacturing and logistics operations find their best fit in 2026. Ignition by Inductive Automation has become one of the most widely deployed platforms in this tier globally, and its licensing model — flat annual fee with unlimited tags, clients, and connections — removes the scaling cost structure that makes enterprise SCADA platforms expensive to grow. Its developer community has produced integration modules for virtually every PLC brand and enterprise software system in common use, which significantly reduces the custom integration work required during deployment.
Tulip occupies a distinct and increasingly important position in the mid-market tier for operations whose primary need is digitizing manual processes rather than connecting automated equipment. Its no-code application builder allows operations teams — not IT departments — to create digital work instructions, quality data collection forms, production tracking applications, and operator guidance tools without writing code. For entrepreneurs whose operations still run heavily on paper-based processes and whose first automation priority is getting accurate, real-time data from human activities on the floor, Tulip is one of the fastest paths to visible operational improvement available at any price point.
AVEVA System Platform serves the upper end of the mid-market for process manufacturing environments — food and beverage, chemicals, water treatment — where its process historian and alarm management capabilities have a long and well-documented track record.
The specialized tier addresses specific automation problems with depth that general platforms cannot match. Sight Machine takes existing production data and applies analytical models to identify the process variables most strongly correlated with quality and throughput outcomes — functioning as an intelligence layer above existing operational systems rather than replacing them. Parsable addresses connected worker operations, digitizing the human execution layer of manufacturing through guided digital procedures and real-time collaboration tools. For operations where variability in human execution is a larger source of quality and throughput inconsistency than equipment performance, Parsable delivers measurable improvement faster than any equipment-focused platform.
The deployment model decision — cloud, on-premise, or hybrid — cuts across all three tiers and deserves more careful consideration than vendor conversations typically give it. Cloud deployment offers faster implementation and lower upfront infrastructure cost but introduces latency concerns for real-time control applications and data sovereignty constraints in regulated environments. On-premise deployment addresses both concerns but places infrastructure and maintenance responsibility on your team. The hybrid architecture that most mature industrial operations are converging on — edge computing for real-time control and local data processing, cloud for analytics and cross-site visibility — captures the practical benefits of both while managing their respective limitations.
The evaluation process that produces good decisions follows a sequence that most vendor guides invert. Internal clarity comes before external evaluation. Define the operational problem in specific, measurable terms. Assess your current data environment honestly — what data exists, where it lives, how clean it is, and what integration work connecting it to a new platform requires. Build a 36-month total cost model that includes implementation services, training, ongoing support, and internal resource cost alongside license fees. Only then does a vendor comparison exercise produce information that is actually useful for making a decision.
The reference customer conversation is the most underutilized step in the entire evaluation process. Every vendor will provide references. The discipline is in who you ask to speak with — operations comparable to yours in size, industry, and technical complexity, not the flagship enterprise deployment that anchors the vendor’s case study library. Ask those references specifically about implementation timeline against what was promised, data preparation requirements against what the vendor communicated during the sales process, and what they would do differently if they were starting the deployment today. The answers to those three questions tell you more about a platform’s real-world fit than any feature comparison matrix.
The complete platform breakdown across all three tiers — including specific feature comparisons, pricing model analysis, and the deployment model decision framework — is inindustrial automation software: the honest comparison for 2026, which covers this topic at the depth a section of this article cannot.
how to implement AI in your factory — a practical roadmap for non-engineers
Everything covered in the previous sections — predictive maintenance, machine vision, supply chain optimization, platform selection — converges at a single practical question that every entrepreneur eventually has to answer: how do I actually start?
The answer is not a technology decision. It is a preparation and sequencing decision. The entrepreneurs who implement AI in industrial automation successfully are not distinguished by their technical sophistication or their budget size. They are distinguished by the discipline they apply before any platform is selected or any sensor is installed. They define problems precisely. They assess their data environment honestly. They sequence their investments based on operational reality rather than vendor enthusiasm. And they measure their results with enough rigor to know what is working and what needs adjustment before they commit to expanding scope.
That discipline is the roadmap. Everything else is execution detail.
The preparation phase that precedes any technology decision has four components, and skipping any of them consistently produces the expensive deployment failures that give industrial automation a reputation for underdelivering. The first is a cost and loss map — a systematic accounting of where your operation is losing money in ways that are measurable, recurring, and large enough to justify an automation investment. Unplanned downtime hours multiplied by fully loaded production cost. Defect escape rates multiplied by the fully loaded cost of a customer return. Inventory carrying cost on slow-moving SKUs. Energy consumption per unit of output against industry benchmarks. Each number, quantified honestly, produces a ranked opportunity list that vendor conversations cannot produce for you.
The second preparation component is a data readiness audit. For each problem on your opportunity map, what data currently exists that is relevant to solving it? Machine sensor data, production records, quality logs, maintenance history, sales data, energy consumption records. Assess both existence and quality. Data that exists in paper logs or inconsistent spreadsheets requires remediation before it can support an automation deployment. Operations that discover this during platform configuration rather than before it consistently experience longer and more expensive implementations than those that address data readiness proactively.
The third component is a process stability assessment. Automation amplifies what already exists in your processes. A stable, well-documented process becomes more efficient when automated. An unstable, poorly understood process produces a faster version of its existing problems when automated. Any process where the primary source of variability is unclear, undocumented, or actively disputed among the people who run it needs process improvement before automation — not automation as a substitute for process improvement.
The fourth component is an organizational readiness evaluation. Does your operation have a clear internal owner for the deployment — someone with both the operational authority to make implementation decisions and the floor credibility to drive adoption among the people whose daily work the system will affect? Implementations without a strong internal owner underperform regardless of platform quality. The technology does not drive its own adoption. People do.
With the preparation phase complete, use case selection becomes a matching exercise rather than a guessing exercise. You have a ranked opportunity list. You have a data readiness assessment for each opportunity. You have a process stability assessment that tells you which problems are ready to automate. The highest-priority use case is the one that sits at the intersection of high financial impact, adequate data availability, stable underlying process, and realistic implementation complexity for your current organizational capacity.
For most entrepreneurial manufacturing and logistics operations, that intersection points to one of three starting points. Predictive maintenance on high-criticality rotating equipment wins when unplanned downtime is the largest item on your cost and loss map and your equipment is already generating sensor data or can be retrofitted with non-invasive sensors at reasonable cost. Machine vision at a single high-volume inspection point wins when defect escape rate is the largest item and your inspection environment has controllable lighting and accessible mounting positions for camera hardware. Demand forecasting for a defined product category wins when inventory carrying cost or stockout frequency is the largest item and your sales data history is clean and covers at least 24 months.
The vendor selection process that follows use case selection is more productive when it is structured around the reference customer conversation rather than the demo. Every platform looks capable in a vendor-controlled demonstration environment. The relevant question is how it performs in an operation that resembles yours — similar size, similar industry, similar technical complexity, similar data environment. Ask every vendor for three reference customers that fit that profile. Talk to all three. Ask specifically about implementation timeline against what was promised, data preparation requirements against what the vendor communicated, and what they would do differently. Those conversations produce more decision-relevant information than any feature comparison exercise.
The implementation execution follows a phased model regardless of which use case you start with. The first 30 days establish data flows and operational baselines — the pre-deployment performance metrics against which the system’s impact will be measured. Days 31 through 60 run the system in parallel with existing processes, validating outputs against operator knowledge and calibrating thresholds before any operational decisions are delegated to the system. From day 61, operational decisions in the deployment scope begin incorporating system recommendations, and the measurement framework tracks impact against pre-deployment baselines on a weekly basis.
The 90-day milestone is a genuine decision point. A well-deployed system at 90 days should be generating measurable improvement against at least two of your core metrics. If it is, the case for expanding scope — additional asset classes for predictive maintenance, additional inspection points for machine vision, additional product categories for demand forecasting — is clear and the organizational confidence to support that expansion is in place. If it is not, the 90-day review gives you the data to diagnose why before the problems compound across a broader deployment.
The scaling sequence that follows a successful first deployment leverages the infrastructure and organizational capability built in the initial phase. Each subsequent deployment is faster and cheaper than the first because the data pipelines are already established, the integration patterns are already understood, the organizational change management muscle is already developed, and the internal credibility of the system — its demonstrated track record within the operation — makes adoption faster with each expansion.
The compounding effect of sequential deployments is where the durable competitive advantage of AI in industrial automation actually lives. It is not in any single application. It is in the operational capability — the ability to identify high-value automation opportunities, prepare deployments effectively, measure results honestly, and expand methodically — that builds with each successful implementation and makes the next one easier, faster, and more impactful than the last.
The complete implementation roadmap — including the full phase-by-phase execution guide, vendor selection framework, and 90-day measurement model — is inAI implementation manufacturing: avoid the costly first mistakes, the most practical resource in this series for entrepreneurs who are ready to move from evaluation to execution.
Conclusion
The honest picture of AI in industrial automation in 2026 is neither the utopian vision of fully autonomous factories nor the skeptic’s dismissal of the technology as overhyped and underdelivered. It is something more useful than either: a set of proven applications, mature platforms, and documented deployment paths that are producing measurable returns for entrepreneurs who approach them with operational clarity and sequencing discipline.
The five application areas covered in this guide — industrial AI applications mapped to specific operational problems, predictive maintenance that converts unplanned failures into scheduled interventions, machine vision that removes the reliability ceiling of human quality inspection, supply chain optimization that replaces static planning with dynamic forecasting, and platform infrastructure that connects the intelligence layer to the physical operation — are not theoretical possibilities. They are working deployments in real facilities, generating real financial returns, operated by entrepreneurs who are not technology specialists but operational decision-makers who chose their starting points carefully and executed with discipline.
The pattern that runs through every successful deployment in this space is consistent enough to be instructive. Start with a precisely defined problem, not a technology category. Assess data readiness before selecting a platform, not after. Set measurement baselines before deployment, not after go-live. Execute narrowly on a first use case rather than attempting broad transformation simultaneously. Measure honestly at 90 days and let the results — not the vendor relationship or the sunk cost — determine what happens next.
That pattern is not complicated. It is disciplined. And in a market full of vendor enthusiasm, implementation complexity, and technology that genuinely works when deployed correctly and genuinely fails when it is not, discipline is the differentiating factor.
The gap between operations that are building durable competitive advantage through AI in industrial automation and those that are watching that advantage accumulate in their competitors is not a technology gap. The technology is available to everyone. It is a decision quality gap — the quality of the problem definition, the honesty of the data readiness assessment, the rigor of the measurement framework, and the organizational commitment to learn from each deployment and apply those lessons to the next one.
Every section of this guide links to a satellite resource that covers its topic in the depth that a pillar article cannot. Those resources exist because the decision to implement AI in industrial automation is not a single decision. It is a series of decisions, each with its own detail, its own trade-offs, and its own execution requirements. The entrepreneur who reads broadly across the landscape and deeply on the specific application they are deploying makes better decisions than the one who relies on a vendor presentation and a reference check.
The operations pulling ahead right now started somewhere specific, measured honestly, and built from there. That is the entire model. Pick the problem that costs you the most. Confirm your data is ready to support a solution. Choose a platform built for your scale. Deploy narrowly. Measure rigorously. Expand methodically.
For entrepreneurs who are ready to move from strategy to execution,AI implementation manufacturing: avoid the costly first mistakesis the most immediate next resource a step-by-step deployment roadmap built specifically for operations that want to get their first AI automation investment right without the trial and error that makes the learning expensive.