
Store layout decisions used to rely on seasonal intuition and sales reports that were already two weeks old by the time you read them. AI customer behavior analytics retail systems give entrepreneurs a live picture of how shoppers move, where they pause, and which displays they ignore entirely. That behavioral intelligence connects directly to the operational advantages outlined in how retail AI vision automation is changing the way store owners compete in 2026. When you can see your store the way a data analyst would, every shelf placement and promotional decision becomes something you can test and measure instead of guess AI customer behavior analytics retail.
The decision you are making without the data you need
Every retail entrepreneur makes layout decisions. Where to place the highest-margin products. Which end-cap gets the seasonal promotion. Whether the entrance display is driving basket additions or just collecting foot traffic that walks past without engaging.
Most of those decisions are made with incomplete information last month’s sales data, a vendor recommendation, or a gut feeling built from years of floor experience. None of those inputs tell you what is actually happening in your store right now, at the behavioral level, in real time.
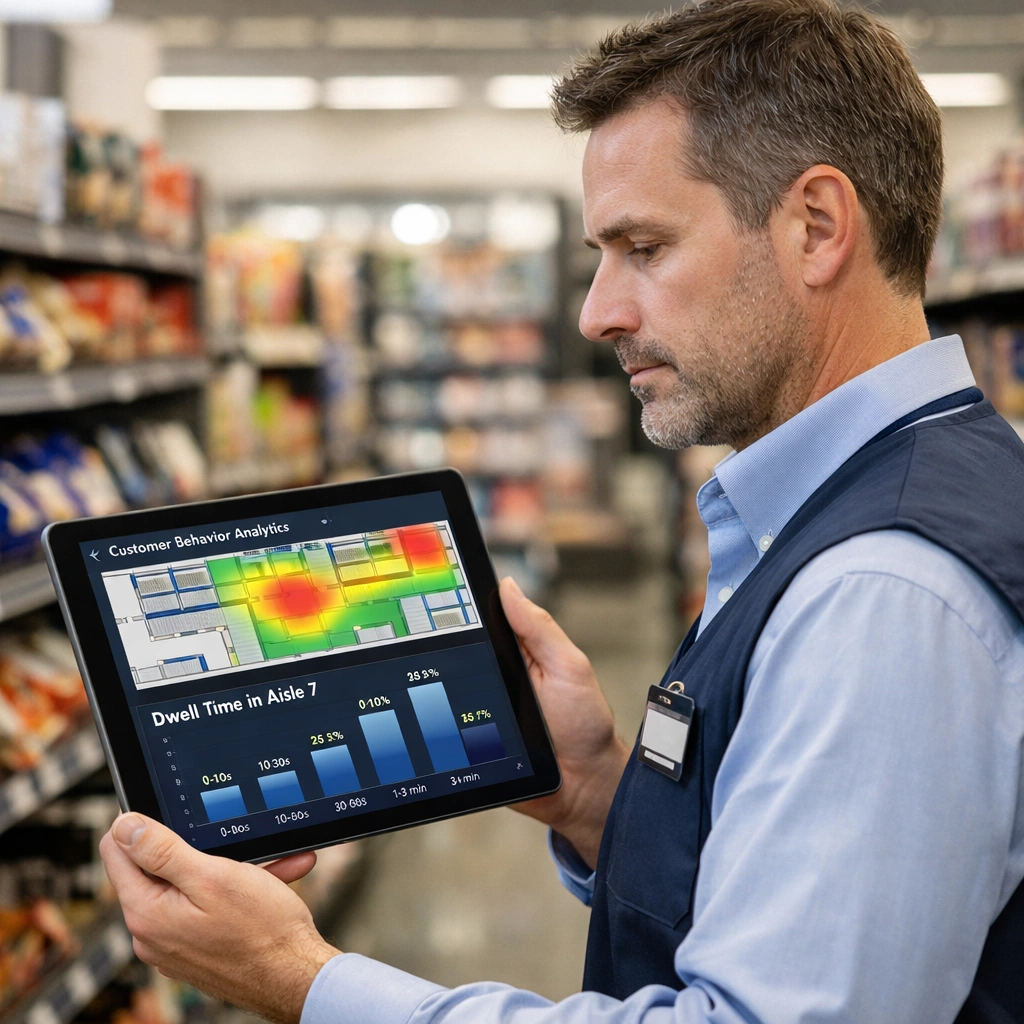
AI customer behavior analytics retail systems fill that gap. They give you a continuous, objective record of how your shoppers interact with your physical space and they turn that record into actionable intelligence that improves layout performance, promotional effectiveness, and ultimately revenue per square foot.
What AI customer behavior analytics retail measures
The data layer that a modern customer behavior analytics system generates goes significantly deeper than a door counter or a basic foot traffic report. The following metrics represent the core of what these platforms track and why each one matters to your bottom line.
Foot traffic volume and flow patterns
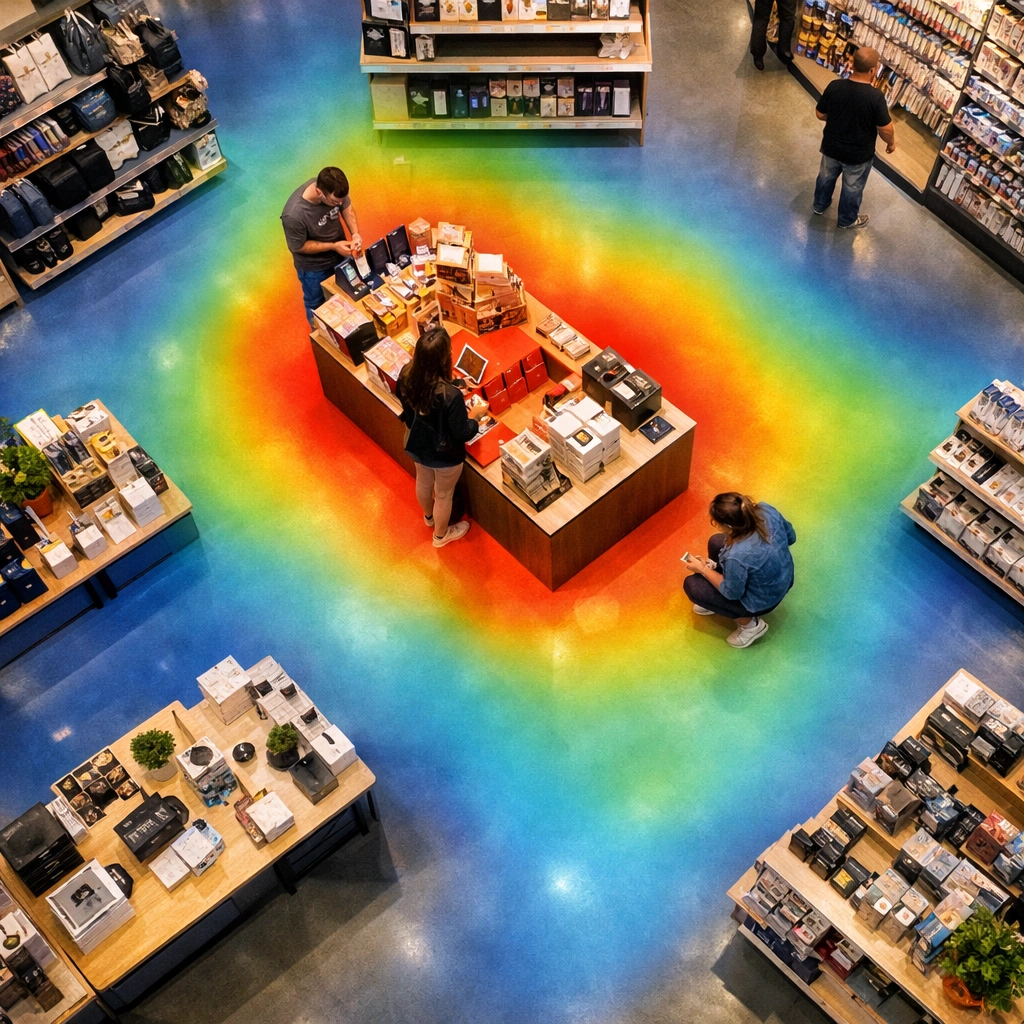
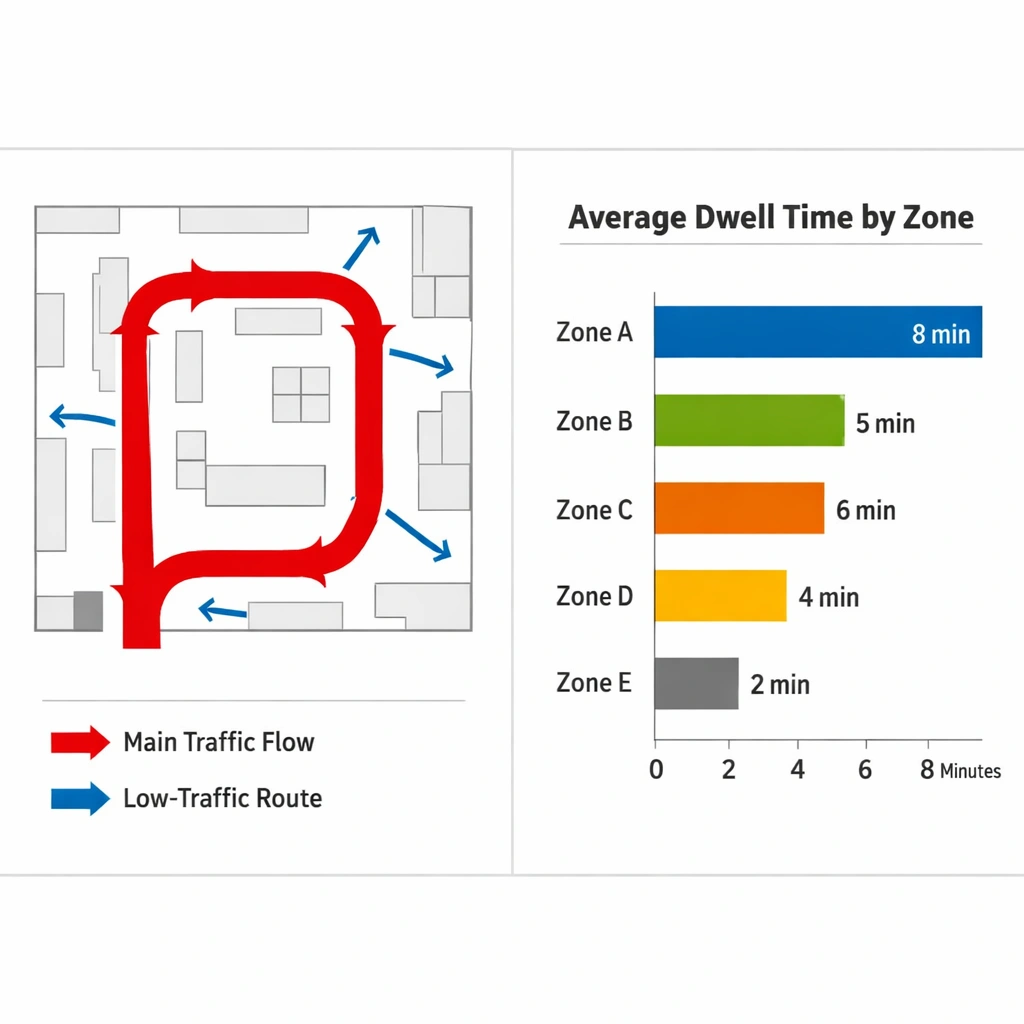
The foundational metric is how many people enter your store and which paths they take through it. But foot traffic volume alone is a weak signal. What matters operationally is flow pattern the routes most shoppers take, the zones they consistently visit, and the areas they skip entirely.
A store where 80 percent of customers never reach the back third of the floor has a layout problem, a signage problem, or a product placement problem and without flow pattern data, you cannot tell which one it is or where to intervene.
Zone dwell time
Dwell time measures how long a shopper spends in a specific area of your store. High dwell time in a product zone is generally a positive signal it indicates engagement. But high dwell time at a specific shelf without a corresponding conversion to purchase can indicate friction: a product that is hard to reach, packaging that is confusing, or a price point that stops the transaction.
AI customer behavior analytics retail platforms that combine dwell time data with point-of-sale transaction data can surface these conversion gaps automatically, giving you a prioritized list of layout or merchandising interventions ranked by potential revenue impact.
Conversion rate by zone
Zone conversion rate is the percentage of shoppers who enter a specific area of your store and make a purchase from that zone. This metric connects behavioral data directly to revenue and is one of the most powerful outputs a customer behavior analytics system can generate.
A promotional display with high foot traffic but a low zone conversion rate is not performing — regardless of how prominent the placement is. A quieter section of the store with a high zone conversion rate among the shoppers who do visit it may be worth relocating to a higher-traffic position.
Without this data, the relationship between traffic and conversion remains invisible. With it, every square foot of your store becomes a measurable revenue asset.
Queue and checkout wait time analysis
Extended checkout wait times are one of the leading causes of basket abandonment and customer attrition in physical retail. AI customer behavior analytics retail systems that include queue monitoring can measure average wait times by hour, flag queue buildup in real time, and generate staffing alerts when checkout capacity falls below the threshold needed to maintain acceptable service levels.
For store owners managing lean staffing models, this data transforms scheduling from a fixed weekly template into a dynamic response to actual customer demand patterns.
How behavioral data changes the way you make merchandising decisions
The most immediate application of AI customer behavior analytics retail data is in merchandising — specifically, the placement of products and promotional displays relative to where your shoppers actually go.
Traditional merchandising relies heavily on vendor recommendations and category management guidelines developed from aggregate industry data. Those guidelines are useful starting points, but they are not calibrated to your specific store, your specific customer base, or your specific traffic patterns.
Behavioral data lets you test and measure merchandising decisions the way an e-commerce operator tests page layouts with real performance data tied to real shopper behavior in your actual environment.
A practical example: you move a high-margin product from its current mid-aisle position to an end-cap at the intersection of your two highest-traffic paths. After two weeks, your customer behavior analytics platform shows a 40 percent increase in zone dwell time for that product and a corresponding lift in category sales. That is a data-confirmed merchandising decision, not a hypothesis.
For entrepreneurs who want to understand how behavioral analytics integrates with the broader store operations layer including shelf monitoring and loss prevention — the full picture is covered in how retail AI vision automation is transforming store operations in 2026.
The privacy architecture behind customer behavior analytics
A common concern among retail entrepreneurs evaluating AI customer behavior analytics retail platforms is customer privacy. The concern is legitimate, and the answer depends entirely on how the specific platform you are evaluating handles data collection and processing.
The current generation of enterprise-grade customer behavior analytics systems operates on anonymized, aggregated data. The system tracks movement patterns and behavioral signals — not identities. No facial recognition is required for foot traffic analysis, zone dwell measurement, or conversion rate tracking. The output is a behavioral map of shopper types and patterns, not a database of individual customer records.
The platforms worth evaluating are explicit about this architecture in their documentation and sales process. If a vendor cannot clearly explain how their system anonymizes data, what is retained versus discarded, and how their approach complies with applicable state privacy regulations, that is a vendor to remove from your shortlist — not because the technology is inherently problematic, but because the vendor is not operating with the transparency a responsible deployment requires.
Connecting behavioral data to your existing business intelligence
AI customer behavior analytics retail data is most powerful when it is connected to the business intelligence tools you already use rather than sitting in a separate analytics silo.
The integrations worth prioritizing are with your point-of-sale system, your inventory management platform, and your staff scheduling tool. When behavioral data flows into these systems, it enriches the decisions those tools support.
Your POS integration creates the zone conversion rate metric described earlier — connecting foot traffic to actual transactions at the category level. Your inventory integration surfaces the relationship between shelf availability and shopper dwell behavior, helping you distinguish between a conversion problem and a stockout problem that is suppressing sales in a specific zone. This is directly related to the operational value covered in AI shelf monitoring retail, where real-time shelf intelligence works alongside behavioral data to give you a complete picture of why a zone is underperforming.
Your scheduling integration uses peak traffic hour data to optimize staffing levels — ensuring that your highest-conversion periods have adequate floor coverage rather than relying on a fixed schedule that may not reflect actual demand patterns.

What a realistic deployment timeline looks like
Entrepreneurs evaluating AI customer behavior analytics retail platforms frequently underestimate the time between hardware installation and first actionable insight. The calibration period — the time the system needs to establish baseline behavioral patterns for your specific store before its anomaly detection and comparative analysis become reliable typically runs two to four weeks.
During this period, the system is collecting data and building the behavioral model of your store’s normal operating state. Alerts and comparative analyses generated before this baseline is established are less reliable and should be treated as directional rather than definitive.
After the baseline period, the platform begins generating the insights that justify the investment — zone performance rankings, peak traffic windows, conversion gap alerts, and promotional effectiveness measurements that give you a data-driven foundation for every merchandising and layout decision that follows.
For entrepreneurs ready to move from evaluation to deployment, how to implement AI vision retail without wasting your budget covers the full deployment sequence from scoping and camera placement through integration configuration and baseline establishment in a format designed specifically for independent and mid-size retail operators.
Conclusion
AI customer behavior analytics retail transforms the physical store from an environment you manage by intuition into one you manage by evidence. The metrics it generates — foot traffic flow, zone dwell time, conversion rate by area, and checkout wait time — are not vanity numbers. They are the operational signals that tell you exactly where your store is converting well and exactly where it is losing revenue that better information could recover.
The stores that build this data layer now are developing a merchandising and operations advantage that compounds over time. Every layout decision informed by behavioral data makes the next one more precise. That compounding precision is difficult for competitors operating on intuition alone to close.